Structure and permeation mechanism of a mammalian urea transporter
By Elena J. Levin, Yu Cao, Giray Enkavi, Matthias Quick, Yaping Pan, Emad Tajkhorshid, Ming Zhou.
Published in Proceedings of the National Academy of Sciences USA 109(28): 11194-9, on July 10, 2012. PMID: 22733730. PMCID: PMC3396522. Link to publication page.
Core Facility: Computational Modeling
Abstract
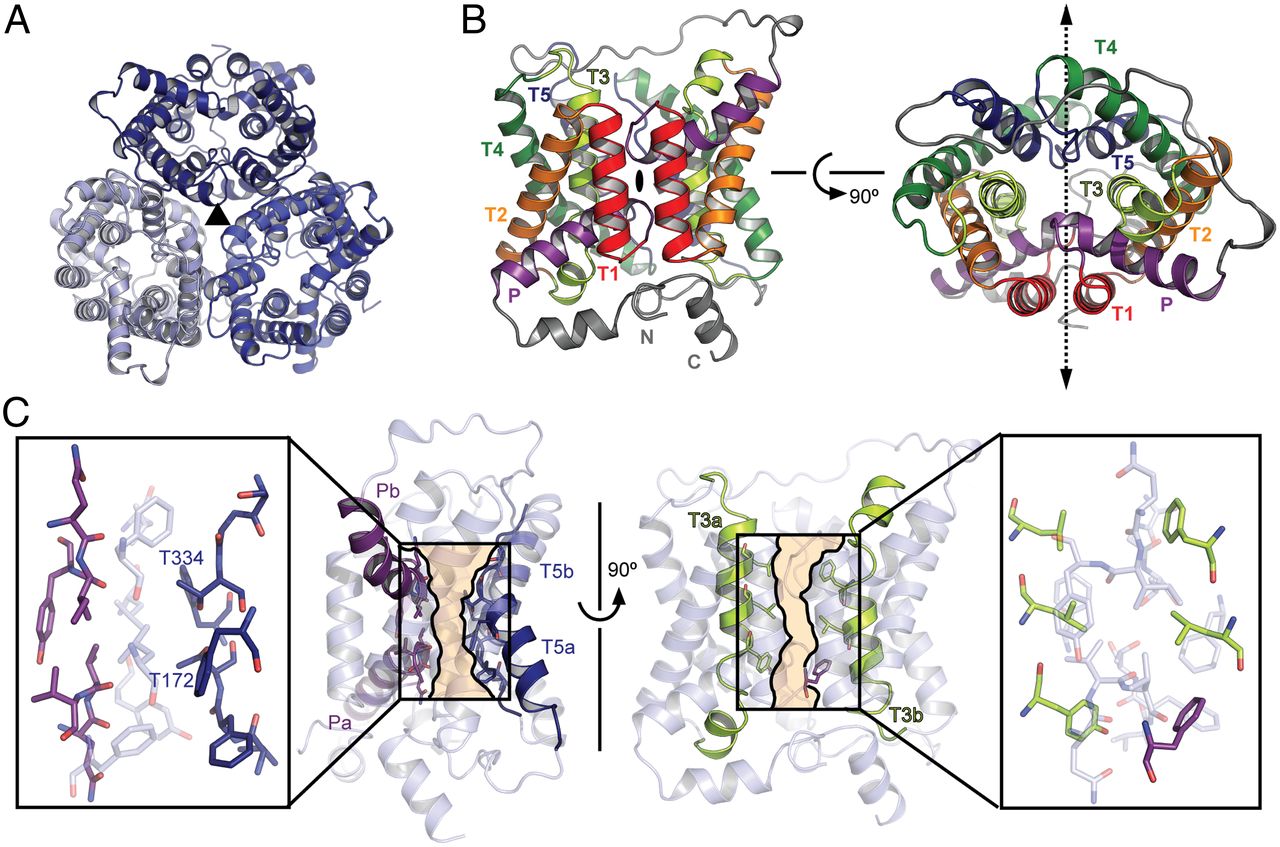
As an adaptation to infrequent access to water, terrestrial mammals produce urine that is hyperosmotic to plasma. To prevent osmotic diuresis by the large quantity of urea generated by protein catabolism, the kidney epithelia contain facilitative urea transporters (UTs) that allow rapid equilibration between the urinary space and the hyperosmotic interstitium. Here we report the first X-ray crystal structure of a mammalian UT, UT-B, at a resolution of 2.36 Å. UT-B is a homotrimer and each protomer contains a urea conduction pore with a narrow selectivity filter. Structural analyses and molecular dynamics simulations showed that the selectivity filter has two urea binding sites separated by an approximately 5.0 kcal/mol energy barrier. Functional studies showed that the rate of urea conduction in UT-B is increased by hypoosmotic stress, and that the site of osmoregulation coincides with the location of the energy barrier.
 Fo-Fc density calculated without ligands in the model (A), and anomalous difference density (B) are shown in the pore of the selenourea/UT-B structure along with key selectivity filter residues. The maps are contoured at 3 and 5σ, respectively. (C) MD simulations were used to reconstruct the potential of mean force of urea permeation through the UT-B pore. The yellow circles indicate the z-coordinates of the central carbons of bound selenourea in the three subunits of the crystal structure, black arrows indicate the z-coordinates of the Sm site threonine CG atoms averaged over the three subunits. (D) The number of hydrogen bonds between urea and the protein (red), water molecules (blue), or both (black) averaged over the MD simulations as a function of the reaction coordinate.")
 Averaged, background-corrected traces showing the change in fluorescence over time from quenching of entrapped dye in WT (red), T334V (violet), and T334S (blue) UT-B-containing proteoliposomes and control liposomes (black), driven by urea efflux, scaled to the theoretical change in volume. (B) Initial rates of urea efflux calculated from these curves and for additional mutants. Errors bars are standard deviations from three or four experiments. (C) 14C-labelled urea uptake in WT or T172S/T334S UT-B mRNA-injected oocytes or in control oocytes after 5 min placed in ND-96 buffer at 0.5, 1.0, and 2.0-fold concentration.")
