Quantitative analysis of the water occupancy around the selectivity filter of a K+ channel in different gating modes
By Markus Weingarth, Elwin A. W. van der Cruijsen, Jared Ostmeyer, Sylke Lievestro, Benoît Roux, and Marc Baldus.
Published in Journal of the American Chemical Society 136(5): 2000-2007 on February 5, 2014. PMID: 24410583. PMCID: 4472312. Link to publication page.
Project: Dynamics of Ion Permeation and Conformational Coupling in – KcsA. Core Facility: Computational Modeling.
Abstract
Recovery in K+ channels, that is, the transition from the inactivated nonconductive selectivity filter conformation toward the conductive conformation, occurs on a time scale of the order of seconds, which is astonishingly long, given that the structural differences among the filter conformations are faint (<1 Å). Computational studies and electrophysiological measurements suggested that buried water molecules bound behind the selectivity filter are at the origin of the slowness of recovery in K+ channels. Using a combination of solid-state NMR spectroscopy (ssNMR) and long molecular dynamics simulations, we sketch a high-resolution map of the spatial and temporal distribution of water behind the selectivity filter of a membrane-embedded K+ channel in two different gating modes. Our study demonstrates that buried water molecules with long residence times are spread all along the rear of the inactivated filter, which explains the recovery kinetics. In contrast, the same region of the structure appears to be dewetted when the selectivity filter is in the conductive state. Using proton-detected ssNMR on fully protonated channels, we demonstrate the presence of a pathway that allows for the interchange of buried and bulk water, as required for a functional influence of buried water on recovery and slow inactivation. Furthermore, we provide direct experimental evidence for the presence of additional ordered water molecules that surround the filter and that are modulated by the channel’s gating mode.
 The distribution of nearest distances to protons of water bound behind the selectivity filter (filled columns), averaged over a long MD simulation of closed-conductive KcsA (starting with crystal structure 1K4C), calculated for filter residues resolved in 1H(1H)13C ssNMR experiments. The mean distances, estimated from MD simulations, are indicated. (b) Same as described in (a) for the closed-inactivated channel (starting with 1K4D). For residues V76 and T75, the nearest distances to protons of S3 water are superposed (open columns). Notably, during about 15% of the trajectory, S3 water is closer than 3.0 A to T75Hβ, which would pronounce spin diffusion transfer that exhibits a r–6 dependence on the internuclear distance r. (c) Snapshot of a 1K4C simulation, representative for the distribution of buried water behind the conductive filter. The ordered K+ hydration shell of cavity water that was resolved in crystal structure 1K4C is illustrated below the filter. (d) Snapshot of a 1K4D simulation, representative for the distribution of buried water behind the pinched filter and the water molecule at the S3 position of the filter pore. The protons used as magnetization receptors in 1H(1H)13C/15N ssNMR experiments are highlighted with spheres. Protons for which we observed in ssNMR experiments the proximity and the absence of buried water are color-coded in yellow and green, respectively.")
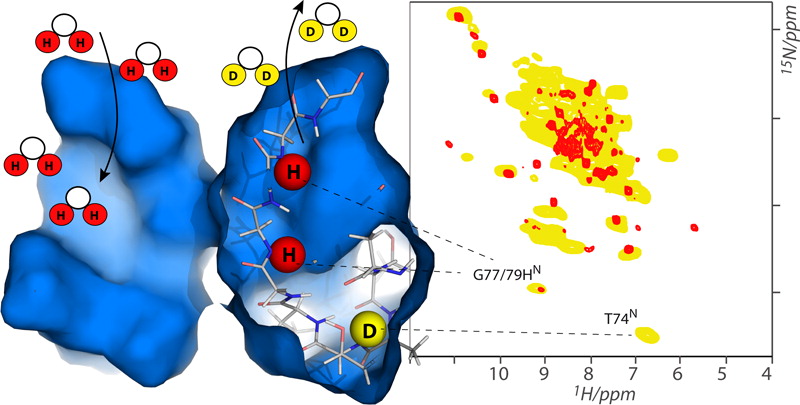
 2D 15N–1H spectrum of fully protonated open-inactivated and closed-conductive KcsA, respectively, measured at 60 kHz MAS and 18.8 T static magnetic field (800 MHz 1H frequency). (b,d) Cutouts of 1H(1H)15N ssNMR spectra of open-inactivated and closed-conductive KcsA, respectively. The gray boxes indicate the limits of the spectral width, and the adjacent signal intensity is spurious. (e) (right) Comparison of 2D NH data on (1H,13C,15N; in yellow) membrane-embedded KcsA in the open-inactivated state to an equivalent (2H,13C,15N; in blue) sample after washing in acidic H2O buffer. The blue numbers represent the 1H line width at half-height (in ppm) of resolved cross-peaks and the G77/G79 signal extracted from the spectrum of the back-exchanged deuterated channel.")
