Simulating the Distance Distribution between Spin-Labels Attached to Proteins
By Shahidul M Islam and Benoît Roux.
Published in J. Phys. Chem. B, 2015 Feb 2;119(10). PMID: 25645890.
Core Facility: Computational Modeling.
Abstract
EPR/DEER spectroscopy is playing an increasingly important role in the characterization of the conformational states of proteins. In this study, force field parameters for the bifunctional spin-label (RX) used in EPR/DEER are parametrized and tested with molecular dynamics (MD) simulations. The dihedral angles connecting the Cα atom of the backbone to the nitroxide ring moiety of the RX spin-label attached to i and i + 4 positions in a polyalanine α-helix agree very well with those observed in the X-ray crystallography. Both RXi,i+4 and RXi,i+3 are more rigid than the monofunctional spin-label (R1) commonly used in EPR/DEER, while RXi,i+4 is more rigid and causes less distortion in a protein backbone than RXi,i+3. Simplified dummy spin-label models with a single effective particle representing the RXi,i+3 and RXi,i+4 are also developed and parametrized from the all-atom simulations. MD simulations with dummy spin-labels (MDDS) provide distance distributions that can be directly compared to distance distributions obtained from EPR/DEER to rapidly assess if a hypothetical three-dimensional (3D) structural model is consistent with experiment. The dummy spin-labels can also be used in the restrained-ensemble MD (re-MD) simulations to carry out structural refinement of 3D models. Applications of this methodology to T4 lysozyme, KCNE1, and LeuT are shown to provide important insights about their conformational dynamics.


 RXi,i+3 and (B) RXi,i+4 (left panel) and the corresponding dynamics of the nitroxide oxygen of the respective RX with respect to their Cα atoms obtained from MD simulation (right panel).")
 i, i + 3 and (B) i, i + 4 of the polyalanine α-helix.")
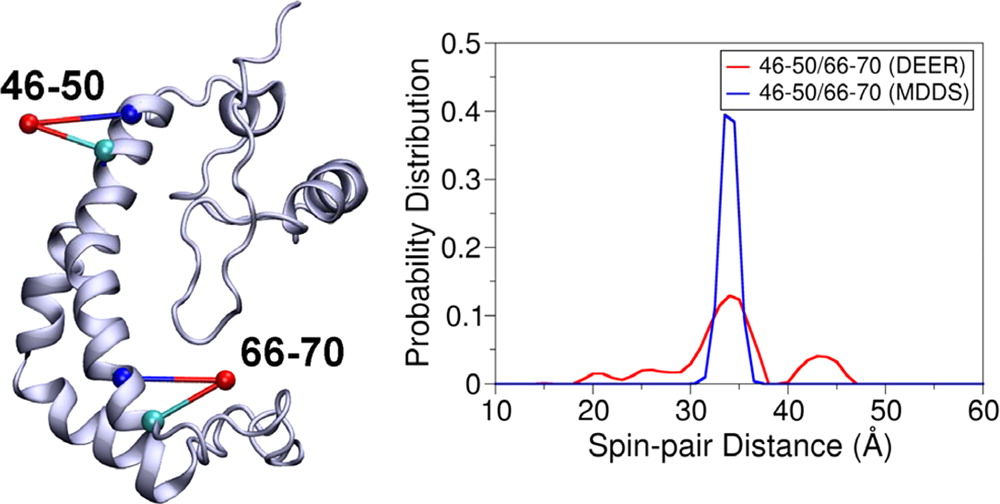
 Cartoon representation of T4 lysozyme with the OND at positions 109 and 131 and the OND4 at positions 109–113 and 127–131 and corresponding distance distributions obtained from MDDS and EPR/DEER. (B) Cartoon representation of KCNE1 with the OND at positions 47 and 66 and the OND4 at positions 46–50 and 66–70 and corresponding distance distributions obtained from MDDS and EPR/DEER.")
