The mechanism of substrate release by the aspartate transporter GltPh
By Jason DeChancie, Indira H Shrivastava, and Ivet Bahar
Published in Molecular bioSystems 7(3): 832-42 on March 1, 2011.
PMID: 21161089. PMCID: PMC3227142. Link to Pubmed page.
Core Facility: Computational Modeling
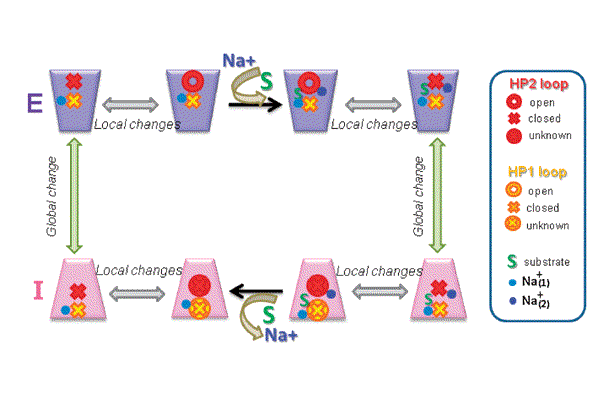
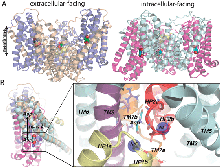
Figure 1. (a) Schematic representation of the substrate transport cycle by Na+-coupled secondary transporters. The transport cycle involves two half-cycles distinguished by different conformations (macrostates) of the transporter: outward-facing (E) and inward-facing (I), each also being subject to local conformational changes (or microstates) between the open and closed conformers of the respective EC and IC gates. The cycle begins from the E state ontop, left which is subjected to local fluctuations (between open and closed conformers of the EC gate while the IC gate is presumably closed), and to possible binding/unbinding of a sodium ion, Na+(1). Stabilization of a Na+(1)-bound open conformer binding primes the subunit for substrate binding, succeeded/accompanied by the binding of a second sodium ion, Na+(2). The presence of bound S and Na+(2) induces a preference for the closed state of the EC gate. Upon enclosure of S and ‘sealing’ of the EC gate by Na+(2), a global change in structure (vertical arrow) from macrostate E to I takes place, while the EC and IC gates probably maintain their closed forms. This transporter in the I macrostate is also subject to local conformational fluctuations that enable the opening of the IC gate and release of the gatekeeper Na+(2) and substrate, succeeded by the possible release of additional cations. Finally, another global change in structure restores the transporter back to its E macrostate and the cycle is poised to repeat.
Abstract
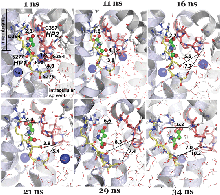
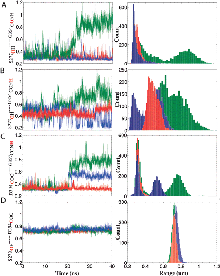
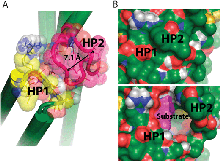
Glutamate transporters regulate excitatory amino acid neurotransmission across neuronal and glial cell membranes by coupling the translocation of their substrate (aspartate or glutamate) into the intracellular (IC) medium to the energetically favorable transport of sodium ions or other cations. The first crystallographically resolved structure of this family, the archaeal aspartate transporter, Glt(Ph), has served as a structural paradigm for elucidating the mechanism of substrate translocation by these transporters. Two helical hairpins, HP2 and HP1, at the core domains of the three subunits that form this membrane protein have been proposed to act as the respective extracellular and IC gates for substrate intake and release. Molecular dynamics simulations using the outward-facing structure have confirmed that the HP2 loop acts as an EC gate. The mechanism of substrate release at atomic scale, however, remained unknown due to the lack of structural data until the recent determination of the inward-facing structure of Glt(Ph). In the present study, we use this recently resolved structure to simulate the release of substrate to the cytoplasm and the roles of HP1 and HP2 in this process. The highly flexible HP2 loop is observed to serve as an activator (or initiator) prompting the release of a gatekeeper Na(+) to the cytoplasm and promoting the influx of water molecules from the cytoplasm, which effectively disrupt substrate-protein interactions and drive the dislodging of the substrate from its binding site. The completion of substrate release and exit, however, entails the opening of the highly stable HP1 loop as well. Overall, the unique conformational flexibility of the HP2 loop, the dissociation of a Na(+), the hydration of binding pocket, and final yielding of the HP1 loop 3-Ser motif emerge as the successive events controlling the release of the bound substrate to the cell interior by glutamate transporters.

